General & Dashboard
General
Web UI Versions
The images and descriptions below refer to the modern web UI. The free firmware uses the Classic web UI, where functions may differ or be unavailable.
General Operation
Saving Settings: Use Save in the settings page header. There is no need to save each row separately.
Dashboard
Overview
The dashboard summarises system status, inputs and outputs, charge/discharge controls and connected data devices in tiles.
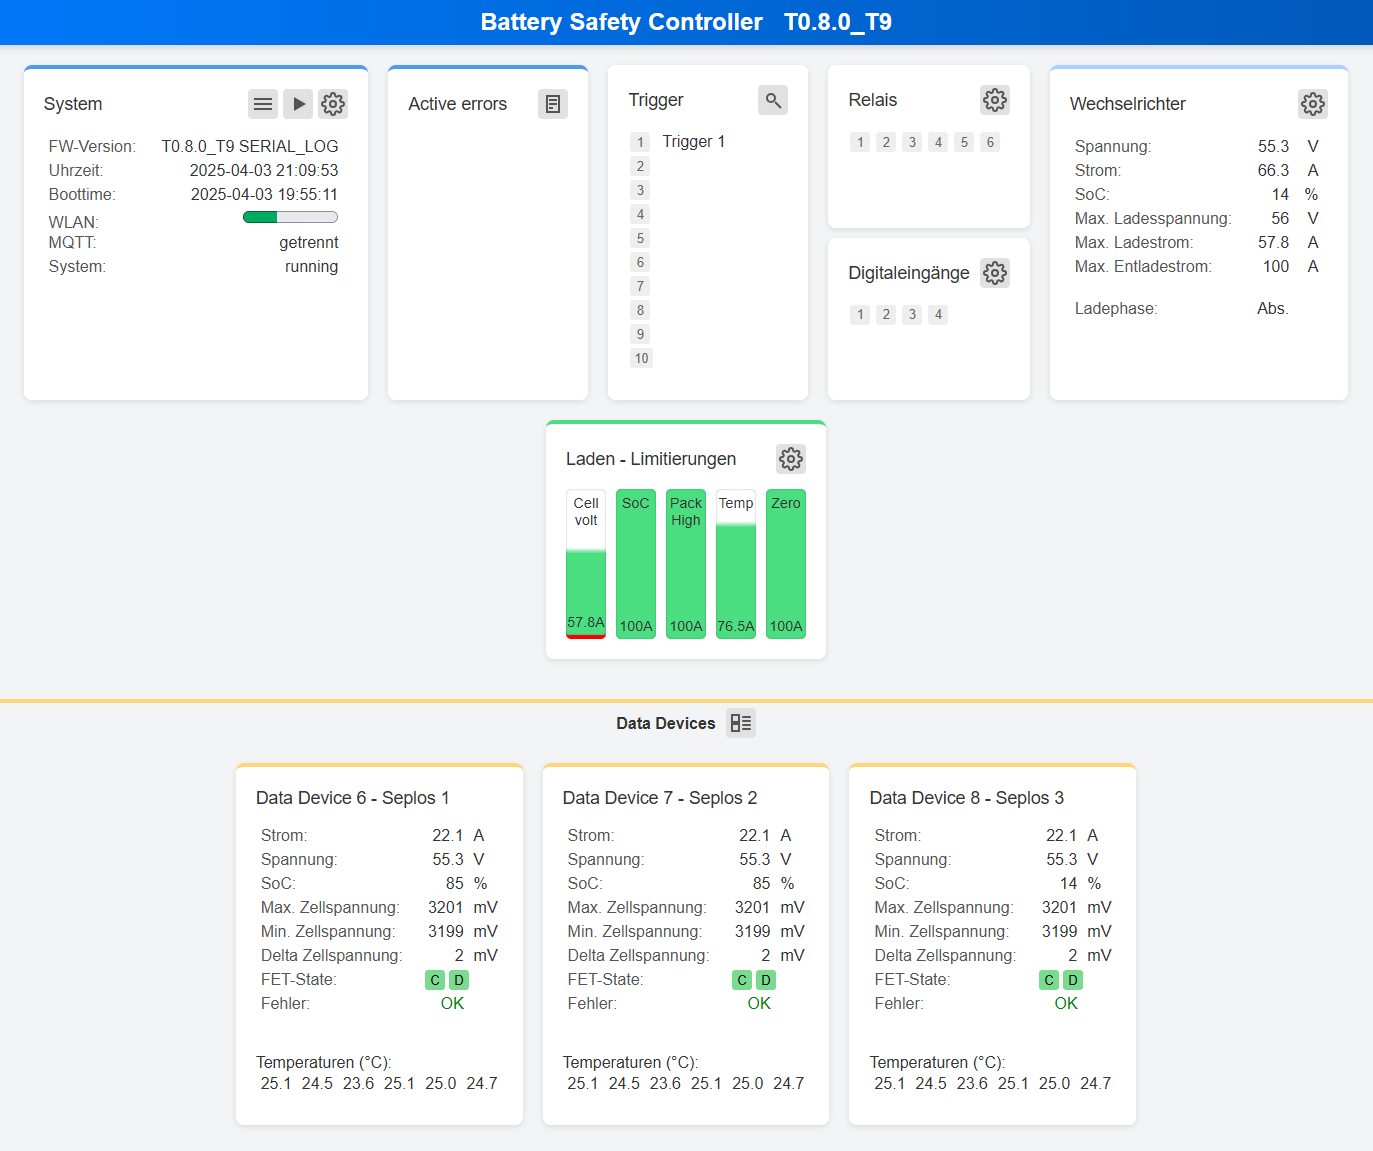
Tiles
System
Displays system status. Buttons:
 Menu: Opens the main menu.
 Live data: Opens live measurements.
 Settings: Opens system settings.
Active Errors
Displays active system errors. Not every log error appears as an Active Error. Possible entries: Data Device x Error, Plausibility Check Error, CANBUS Error.
 Log: Opens the log file.
Triggers
Displays configured trigger states and descriptions. Active trigger numbers change from light grey to dark grey.
 Trigger overview: Detailed view of used triggers and functions.
Relays and Digital Inputs
Displays current states. Active inputs or outputs change from light grey to dark grey.
Inverter
Displays values sent to the inverter: voltage (V), current (A), SoC (%), maximum charging/discharging values (V, A), and current charge phase (Float, Absorption).
Charging Limits
Each enabled control has a bar indicating its maximum permitted charging current.
| Charge control | Dashboard label |
|---|---|
| Cell-voltage-dependent current reduction | Cell volt |
| SoC-dependent reduction | SoC |
| Cell voltage difference reduction | Cell drift |
| Charge-Current Cut-Off | Cut Off |
| Excessive pack current | Pack High |
| Temperature-dependent reduction | Temp |
| Temperature profile | Temp Prf. |
| Voltage control for current limiting | Zero |
Discharging Limits
Each enabled control has a bar indicating its maximum permitted discharging current.
| Discharge control | Dashboard label |
|---|---|
| Cell-voltage-dependent current reduction | Cell volt |
| Excessive pack current | Pack High |
| Temperature-dependent reduction | Temp |
| Temperature profile | Temp Prf. |
Data Devices
Displays live data from connected devices.
 The header button switches to cell voltages.